


The US Healthcare System Explained: How Medicare Builds STAR Ratings
A practical guide for every healthcare operator driving care quality and delivery

Who Should Read This?
This guide is for anyone working to improve healthcare quality and delivery:
Clinicians and care leaders navigating Medicare Advantage quality levers
Product builders and health tech innovators creating tools that improve outcomes through quality data
Strategists and policy experts exploring how incentives shape care models and system behavior
Recap & What’s Next
In previous part of this series, we explored the US insurance landscape including the types of plans, costs, coverage and how individuals engage with them. (Missed it? Catch up here).
This edition takes a deeper dive into Medicare Advantage where financial incentives meet care delivery and explains how CMS STAR Ratings influence plan growth, provider performance and product innovation.
What you will learn in this guide:
What is Medicare Advantage?
Medicare Advantage (MA), also known as Part C, is a private insurance alternative to Original Medicare, approved and regulated by the Centers for Medicare & Medicaid Services (CMS). MA plans typically bundle:
Part A (Hospital)
Part B (Medical)
Part D (Drug coverage)
But MA is more than bundled coverage, where payments, quality and patient outcomes all come together.
How does payment work?
CMS pays MA plans a fixed capitated amount per member. But how much a plan actually earns depends on its quality performance which is primarily measured by STAR Ratings.
Medicare’s Quality Scorecard: Overview, Data Sources, Levels
CMS created STAR Ratings to help Medicare members compare plans. Over time, STAR Ratings have become a major driver affecting payments, plan benefits, provider contracts and growth.
What is STAR Rating?
Plans receive a yearly score from 1 to 5 stars based on many quality measures. Higher stars mean more trust, better member benefits and more money for the plan.
Where does data come from?
Four main sources:
Health Plan Reported Data: HEDIS (Healthcare Effectiveness Data and Information Set), Part C & D Reporting Requirements and Medication Therapy Management (MTM) & SNP Model of Care Data
CMS Member Experience and Outcomes Surveys: CAHPS (Consumer Assessment of Healthcare Providers and Systems) and HOS (Health Outcomes Surveys)
CMS Administrative Data: Medicare claims and encounter data, Enrollment and disenrollment records & Audit and compliance results
CMS Contractors: Support data validation, audit processes & survey administration
These data sources combine to give a full picture of plan performance.
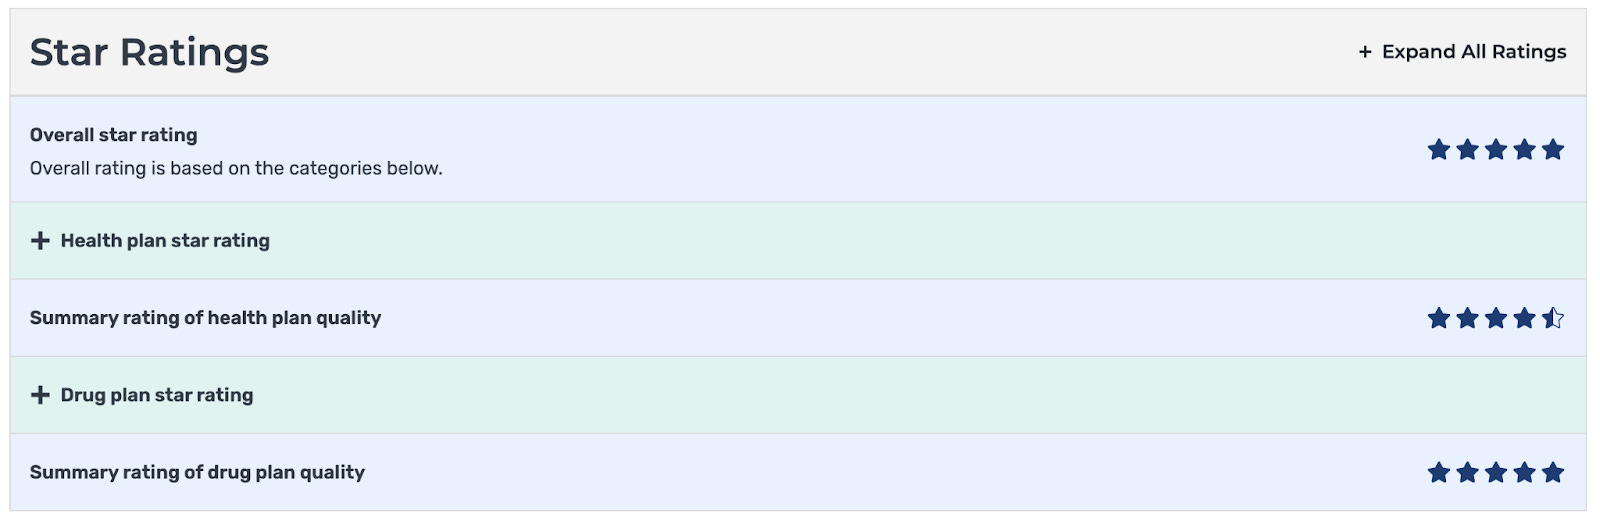
Introduction to Levels
CMS evaluates plans based on 4 levels to create the STAR Ratings:

Overall STAR Rating
A combined score of the Part C and Part D Summary Ratings.
Determines a plan’s eligibility for bonuses, rebates and marketing advantages.
Summary Rating
Health Plans (MA-Only; Part C Rating)
Combined MA with Drug Plans (MA-PD; Part C Rating)
MA-PD and stand-alone Drug Plans (Part D Rating)
Domain Rating
CMS combines various measures to measure performance across 5 important areas:
Outcomes (Drug Safety and Accuracy): Like hospital readmissions and mortality rates
Intermediate Outcomes (Managing Chronic Conditions): Examples include blood pressure and diabetes control
Patient Experience (Member Experience and Complaints): Based on CAHPS surveys that capture member satisfaction
Access (Customer Service): Measures such as how easy it is for members to schedule care
Process (Staying Healthy): Includes preventive care activities like cancer screenings and medication adherence
Measure Rating
Each individual quality measure (e.g., blood pressure control, cancer screening) is assigned a score based on performance.

How it is calculated?
Each measure is assigned a star using cut points based on national percentiles which is updated annually. Weighted scores are aggregated into summary ratings for Part C, Part D and an overall score (e.g. 4.5 stars).

Steps to calculate:
Calculate domain-level scores by multiplying weight and STAR Rating for each measure.
Sum weighted scores for both Health Plan (Part C) and Drug Plan (Part D).
Calculate Summary Ratings for each plan type.
Combine scores based on the assigned weights.
Calculate Overall STAR Rating by dividing the total weighted score by the total weight.
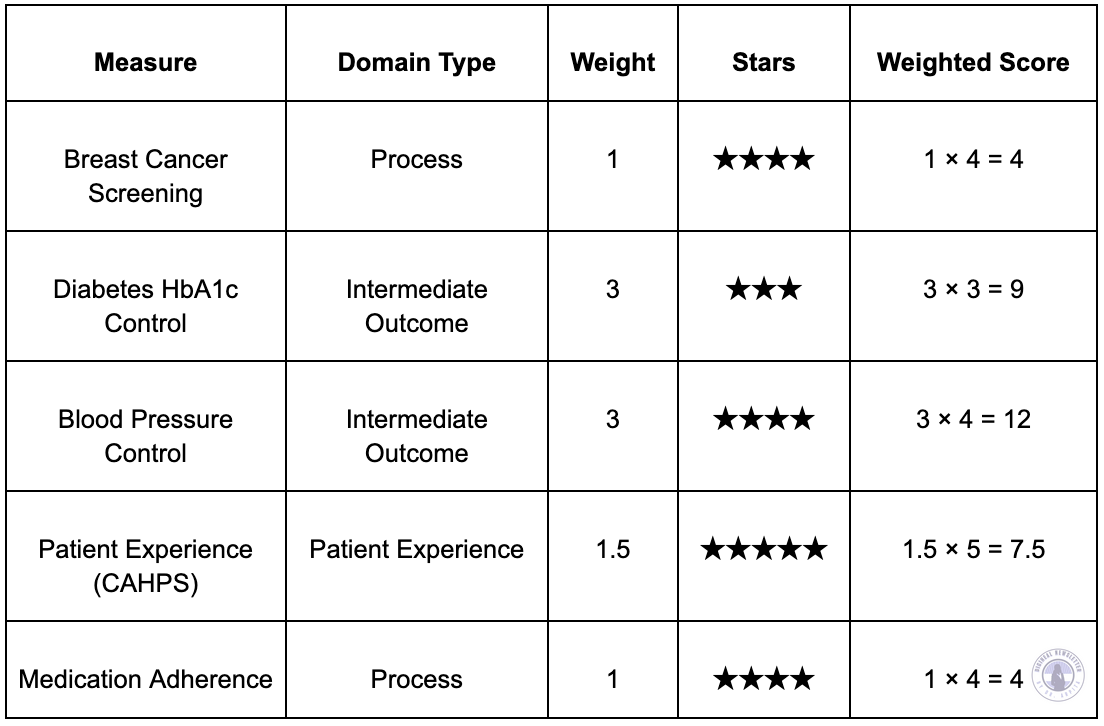
Hypothetical Scenario: ABC Health Plan's 2025 Quality Performance
ABC Health Plan recently completed its annual quality review using a set of 5 healthcare performance measures. These metrics help track how well the plan is managing chronic conditions, preventive screenings, medication adherence and patient satisfaction. Here is how ABC Health Plan performed:
For members of ABC Health Plan, this performance means:
Members are likely receiving high-quality care for managing blood pressure.
Preventive services like breast cancer screening and medication adherence are being monitored effectively.
Most importantly, patient voice is being heard, as reflected in the top-tier patient experience rating.
Summary Rating Calculation
A) Health Plan (MA-PD): Includes Breast Cancer, Diabetes HbA1c Control, Blood Pressure Control, Patient Experience and Medication Adherence.
Total Weighted Score = 36.5
Total Weight = 9.5
Summary Rating = 36.5 / 9.5 = 3.84 → Rounded to 4 stars
B) Drug Plan (PDP): Includes Medication Adherence.
Total Weighted Score = 4
Total Weight = 1
Summary Rating = 4 / 1 = 4 stars
Overall STAR Rating Calculation:
We can assume the assigned weights for the Health Plan and Drug Plan are 8 and 21 respectively.
Total Weighted Score = (4 stars x 8) + (4 stars x 21) = 32 + 84 = 116
Total Weights = 8 + 21 = 29
Overall STAR Rating = 116 / 29 = 4 stars
Why it matters financially?
Medicare Advantage plans that earn 4 stars or higher receive rebates (additional funding) from the government through Quality Bonus Payments.
What does this mean for the plans?
They get 5% more money from Medicare.
They also receive larger rebates they can use to:
Lower costs for members, such as reducing premiums or copays
Add more benefits like dental, vision or transportation services
Hire more providers or invest in better technology
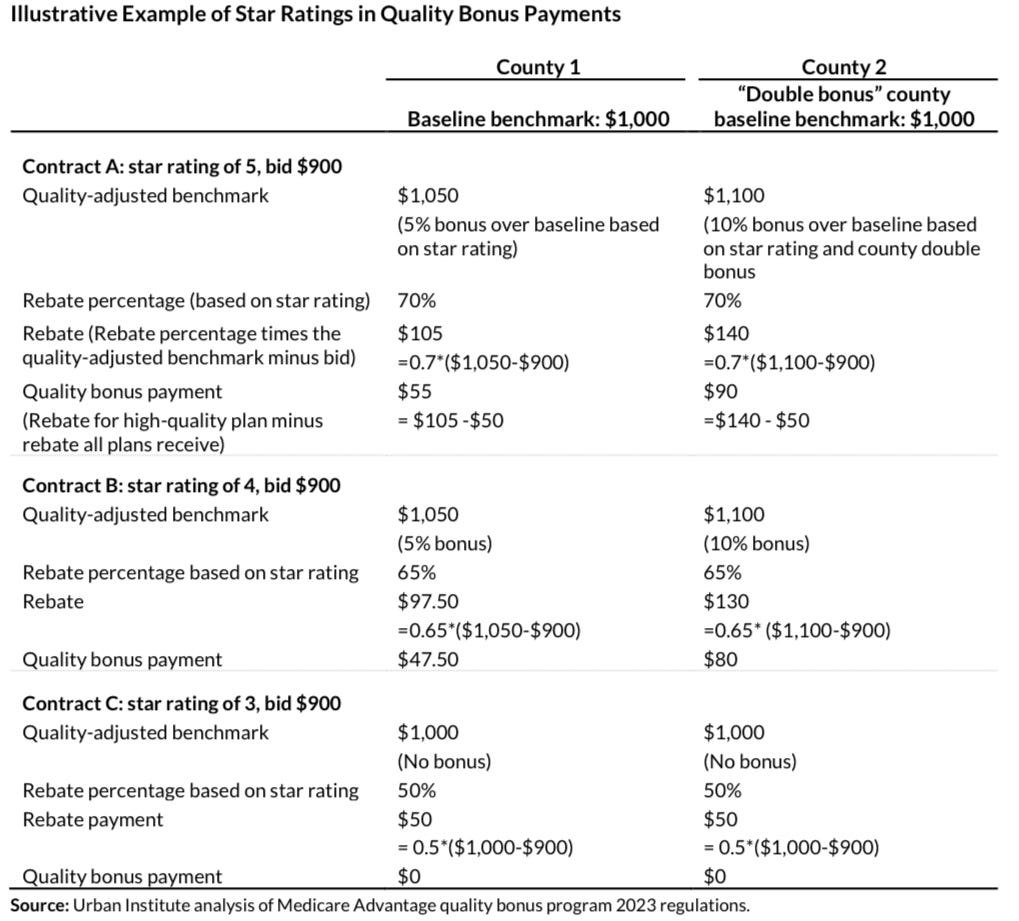
How does rebates work?
MA plans submit bids estimating the cost to provide Medicare benefits. CMS sets a benchmark for each county, which is the maximum amount CMS will pay. If a plan’s bid is below this benchmark, CMS returns the difference to the plan as a rebate.
The size of this rebate depends on the plan’s STAR rating:
Higher STAR ratings (4 stars or above) earn a bigger percentage of the rebate.
Lower-rated plans receive a smaller percentage.
Example: If the benchmark in a county is $1,000 per member and a plan bids $900, the potential rebate is $100. A 5-star plan might get back 70% of that rebate ($70), while a 3-star plan might receive only 50% ($50).
This means → Higher STAR Ratings = Bigger Rebates = More benefits, lower costs and better care for members.
Who Benefits?
Brokers: Earn more commission for selling higher-rated plans. Example: $950 for a 5-star plan vs. $650 for a 3-star plan.
Providers: Can earn bonuses when their care helps improve plan rating.
Health Plans: Grow faster, attract more members and even see their stock prices go up (if public).
How it impacts care delivery?
Plans scoring below 3 stars risk penalties or losing CMS contracts, making quality improvement critical. STAR Ratings have pushed plans to:
Improve Care Coordination
Focus on Prevention
Enhance Patient Experience
Reduce Hospital Readmissions
Close Care Gaps
Ensure Better Care for All
Provide Financial Incentives for Quality
Encourage New Care Models
What’s in it for You?
For Clinicians & Care Leaders
Keep your daily work focused on hitting key quality goals like HEDIS and CAHPS.
Participate in value-based contracts that reward strong STAR scores.
Be part of creating care programs that actually make a difference for patients.
For Product Builders & Health Tech Innovators
Build smart tools that boost quality like a tool helping with missed care alerts and timely patient reminders.
Use STAR ratings data to pinpoint features that drive plan growth and boost bonus potential.
Make sure your tools play by CMS’s rules when collecting and reporting data.
For Strategists & Policy Makers
Discover how financial incentives and quality scores work together to drive better care.
Learn how to design value-based care models that are sustainable and impactful.
Explore top-performing plans and uncover the strategies behind their success.
Want to explore more?
Check out these resources:
Coming Up Next
Get ready for a special two-part series diving deep into HEDIS. We will explore everything from its key measures and sampling methods to data reporting, auditing processes and how HEDIS scores drive quality improvements and innovation in healthcare. Stay tuned!
Curious about a topic or have suggestions? I’d love to hear from you!